Best practices

Sample KPIs for In-House Legal Teams

September 6, 2023
|
Kathy Zhu

Table of Contents

Key Performance Indicators (KPIs) are quantifiable metrics that highlight how well a team or organization is moving towards its goals. Creating and regularly reporting on KPIs ensures greater accountability for legal teams to keep improving how they operate — improvements happen if progress is tracked — as well as a greater sense of accomplishment and fulfillment if strong results are shared and made visible to leadership.

Some organization-level KPIs can be obvious — is revenue growing and are expenses reasonable? However, monetary KPIs only tell part of the story of how well a company operates. How can we evaluate the performance of departments that don't have a clear direct line to financial performance? Historically, it can be very difficult for Legal to create KPIs, as much of the work that Legal takes on is responsive and tied to company initiatives, which are often large-scale projects like new country expansion, ensuring a new product is ADA compliant, or GDPR compliance.

Some overall KPIs for legal departments might include:

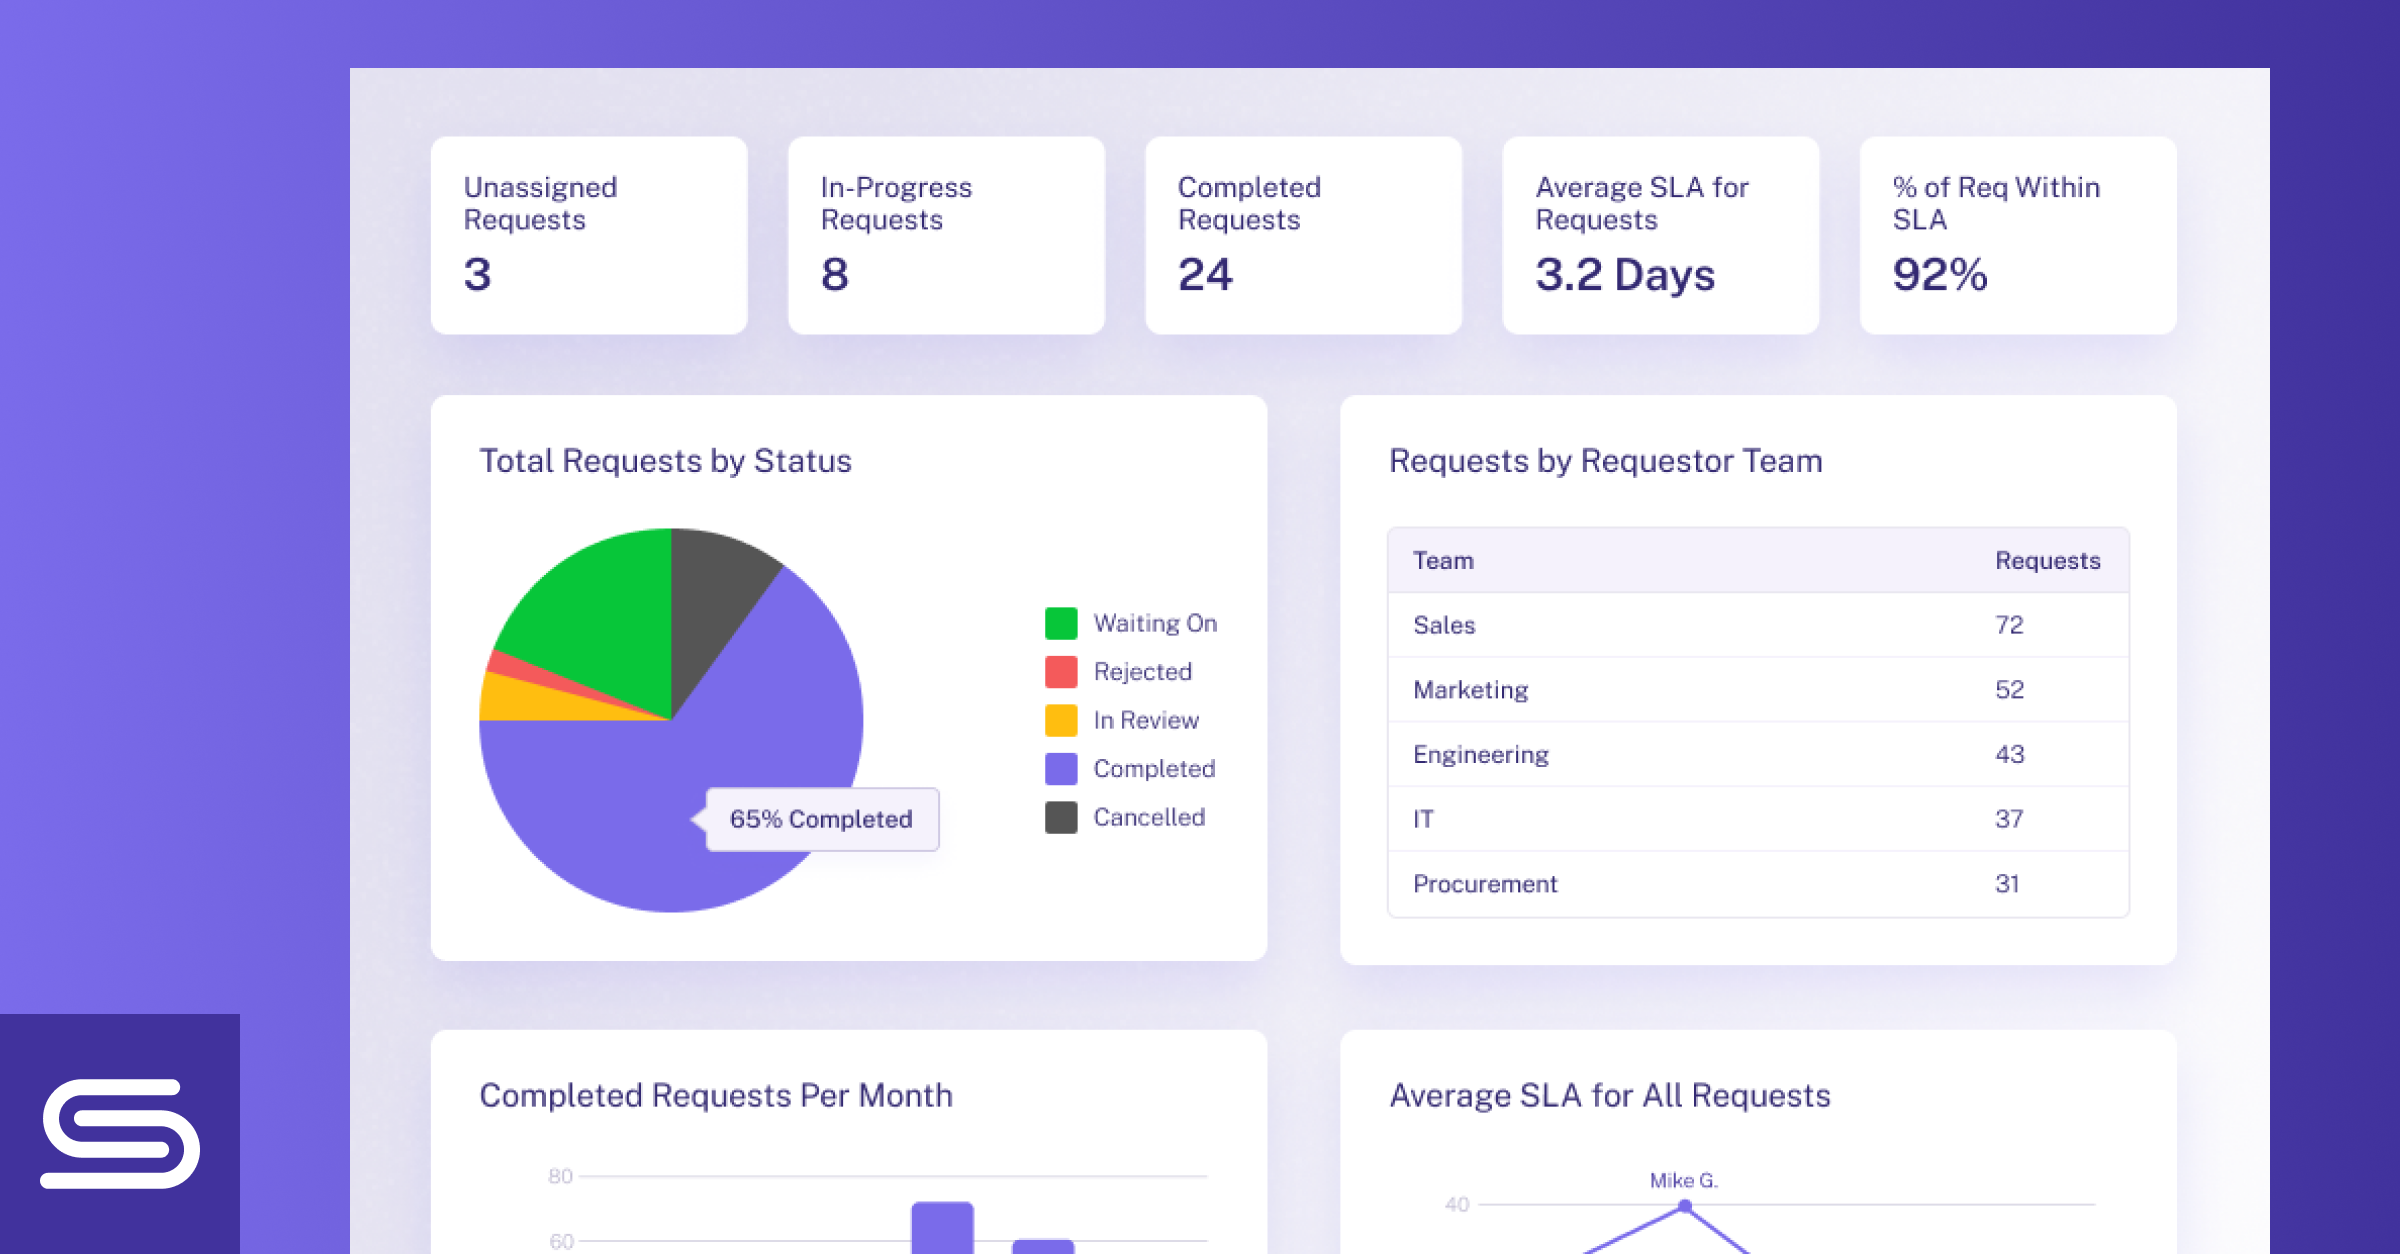
  • Request volume (overall, by business team, by request type, by team member)
  • Average processing time/SLA (overall, by business team, by request type, by team member)
  • Legal team engagement: How happy are the members of the team?
  • Customer satisfaction: How satisfied are business stakeholders (Sales, Marketing, HR, Engineering, Product, etc.) with the legal department?

When it comes to sub-departments in Legal, there are a few areas where it’s been possible (and encouraged) to create measurable KPIs:

  • Commercial Legal
  • Intellectual Property (IP)
  • Legal Ops around spend management 
  • Litigation

For other areas of Legal, it can be helpful to have a strategic planning process on a quarterly basis (for startups and growth companies), or at least on a 6 month basis (for more mature companies). This process should comprise a mix of tracking ongoing projects, which should ideally occupy 75% of the time until they’re closed out, and allocating 25% to new projects added to the slate. It’s important to ensure that there’s a good balance of short term projects that can help increase momentum and are quick and easy to check off, along with longer term projects that span across multiple quarters

Remember, the relevance of each KPI hinges on the context and what will drive meaningful change at the company. While the below is a comprehensive list of sample legal team KPIs, it’s important to concentrate on the KPIs that directly correlate to success for your specific team and organization. Too many KPIs can dilute focus and result in too much time spent tracking, analyzing, and reporting. 

Getting KPIs right is a multi-step process. Learn more about KPI best practices here.

Commercial Legal

Monitoring the entirety of contracts and their related workflows equips legal departments with a clearer insight into the operational efficiency, enables fine-tuning of involvement, response times, and overall contribution to business dealings. Key metrics include:

  1. Total number of contracts per contract/workflow type:
  • All workflows quarter over quarter, first half (H1) vs second half (H2), year-over-year
  • Legal involvement %
  1. SLAs:
  • Average time Legal takes with first response to redline, sales, vendor, partnerships
  • Average time Legal takes with first response to Master Service Agreements (MSAs) on the company’s paper vs. third party paper
  • Average time different approval teams take to handle approvals, i.e., infosec, account, product, etc.
  • Average time sales requests take to close out measured across industry verticals (i.e. what’s the average time it takes to close a deal with a hospitality versus a retail company) 
  • All of these measured across quarters to analyze trends
  1. Workload
  • How many requests each member of the team has been assigned quarter-over-quarter, H1 vs H2, year-over-year (analyzed according to complexity)
  • How many requests each member of the team has closed out quarter-over-quarter, H1 vs H2, year-over-year
  1. Headcount: Commercial Legal vs. GTM year-over-year
  • Total Commercial Counsel & Contract Managers year-over-year
  • Total GTM year-over-year
  • Percentage Commercial Counsel v. GTM year-over-year
  1. Average legal cost/agreement quarter-over-quarter, year-over-year vs. Goal
  1. Value of agreements requiring Legal review (H1 v. H2, year-over-year)
  • Overall
  • As a percentage of all deals
  • Average by contract type 
  1. Average assignment time for new agreements requiring legal support by week/month/year-to-date
  1. Total number of outsourced contracts by month, quarter-over-quarter, year-over-year

Intellectual Property

Tracking the trajectory of intellectual assets, from patents to trademarks, not only safeguards a company's unique propositions but also emphasizes its ability to innovate. Key metrics include:

  1. Patents:
  • Number of inventions submitted
  • Number of patent apps filed
  • Number of new inventors 
  • Company portfolio trajectory
  • Number of patents granted
  1. Trademarks:
  • Number of trademark and domain/clearance registrations

Budget and Professional Services Spend

Understanding and optimizing budget and professional services spend ensures that the department operates within its fiscal limits (is no more than X% of the company’s annual revenue) while still achieving its core objectives. Key metrics include:

  1. Spend
  • External spend staying under $XXX Annually or XX% ARR
  • Internal spend staying under $XXX Annually or XX% ARR
  • Total spend within annual budget
  • Total cost of Legal (internal and external services)
  • Legal spend as a percentage of ARR
  • Budget against actual spend and rationale
  • Year-over-year costs and variance analysis
  1. Outside counsel spend by business, firm, location, and practice area:
  • Most recent month
  • Year to date
  • Current year budget
  • Prior year in full
  1. Allocation of outside counsel spend
  2. Year-over-year outside counsel spend trend analysis
  3. Ratio of full-time (FTE) lawyers to overall internal and external legal spend 

Litigation

By quantifying and analyzing litigation metrics, companies can anticipate potential risks, effectively plan defense strategy, and understand the financial implications of their legal proceedings. Key metrics include:

  1. Litigation as % of overall spend
  2. Number of cases settled/resolved in a month (if applicable)
  3. Number of cases settled in a quarter valued over $50k, $100k, $500k, $1M
  4. Number of settled cases per quarter; number that were high risk
  5. Number of key litigation milestones reached in a month
  6. Average costs of litigation matter quarter-over-quarter, year-over-year

Learn more about how Streamline AI can help you track your legal team's KPIs automatically by scheduling your free demo today.

Read more

Work smarter

Scale your legal team's efficiency and effectiveness with modern workflow automation tools designed for in-house legal.

Request a Demo